 Enji's Blog
Prometheus: Micro Crash Course
From zero knowledge of Prometheus to understanding the difference between increase(), rate(), and irate().

This short article will quickly guide you through the most important basics of Prometheus in an easy-to-understand way - no prior knowledge required.
Prometheus is an open-source software for monitoring your applications, and can also be used for sending alerts if something goes wrong. First, you have to make sure that the monitored applications provide the relevant data via simple HTTP endpoints. Prometheus comes with a range of client libraries that can be embedded into your applications for exactly this purpose. These endpoints are then periodically queried (or scraped) by Prometheus, which stores the collected data in its time-series database. And finally, the data that has been collected from various sources can be visualized, either directly via the Prometheus user interface, or by retrieving it from yet another HTTP endpoint provided by Prometheus itself. In many cases, Grafana is used for creating neat-looking dashboards by querying this Prometheus endpoint.
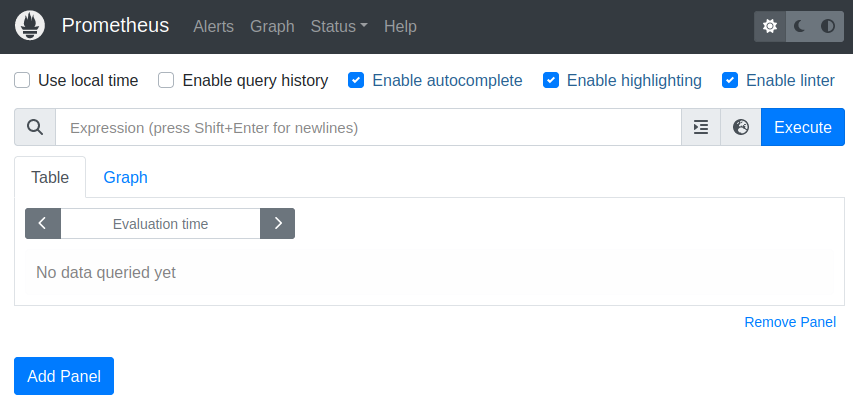
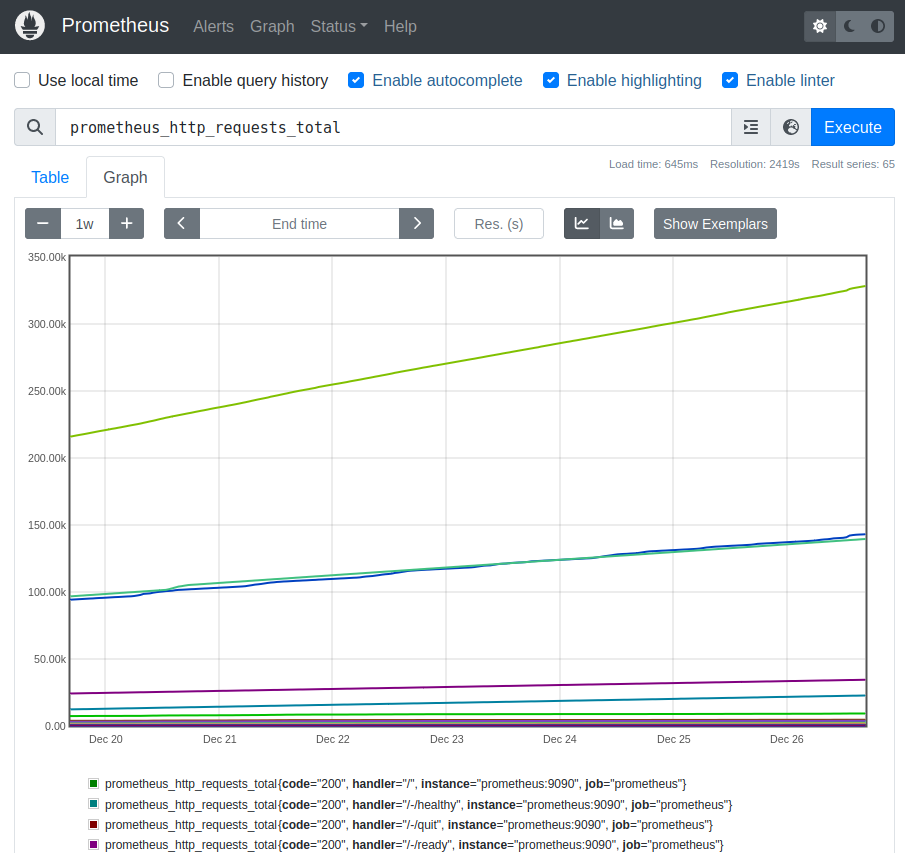
To get started quickly, you can easily install Prometheus on your local machine, or use the demo deployment at promlabs.com. This is how the Prometheus user interface looks like when you first open it:
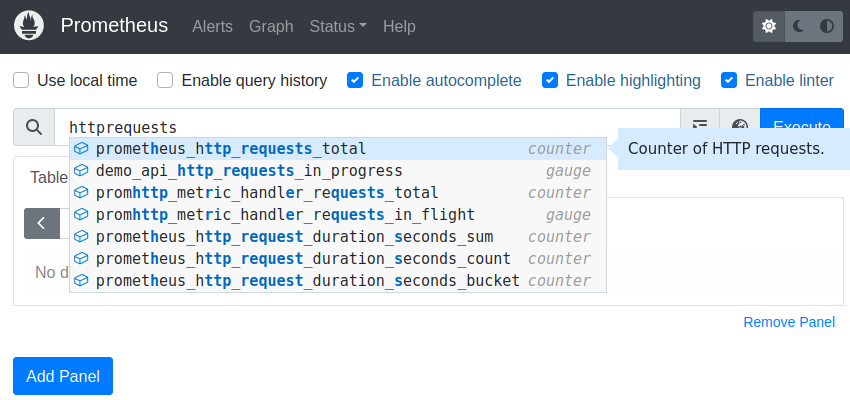
Prometheus organizes its data in metrics. The auto-completion in the “Expression” input field helps you to find the one that you are looking for. For example, Prometheus provides you with monitoring data about itself out-of-the-box, and we would like to retrieve the number of HTTP requests that Prometheus has received so far:
Selecting the correct metric name “prometheus_http_requests_total” and executing this simple query gives you a separate result line for every “handler” (or endpoint) of Prometheus. In the following example, we get 65 of these result lines, and the screenshot displays the first six of them:
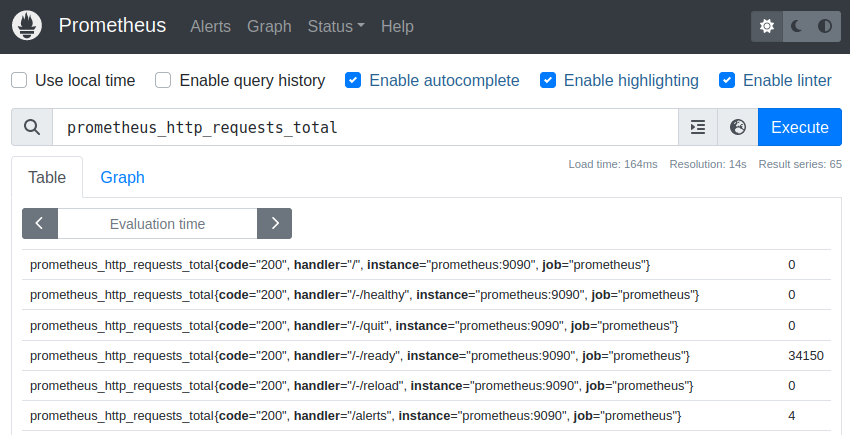
The data from the screenshot above means that the “/-/ready” endpoint has received 34150 HTTP requests since this Prometheus instance has started counting. This type of result is called an instant vector in Prometheus terminology, which simply means that this is a list of values at a certain point in time.
If you are interested in a certain subset of this data, you can filter it by using the tags of the metric. For example, if you only want to retrieve the value for the “/api/v1/query” handler, you can execute the following query:
prometheus_http_requests_total{handler="/api/v1/query"}
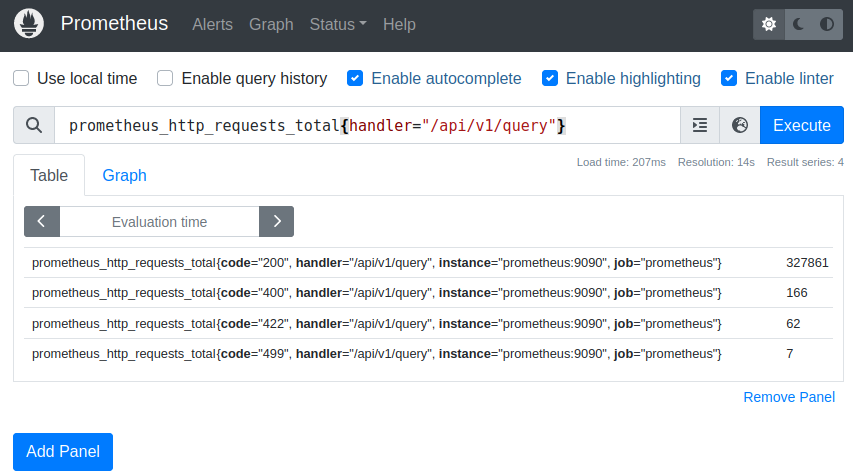
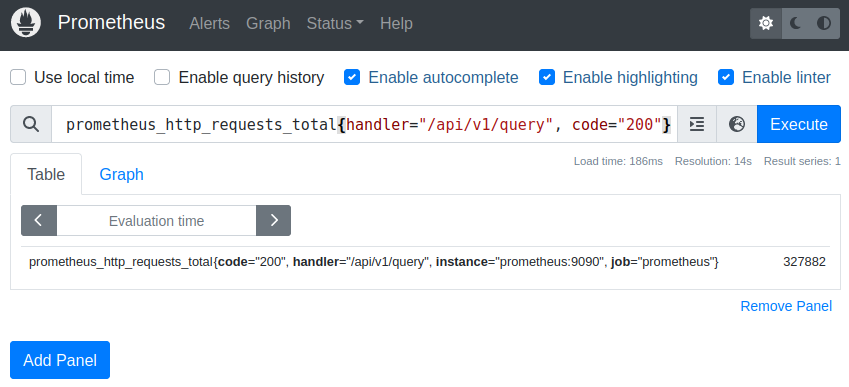
We still get four result series with this filter, so we add another restriction that only returns those with an HTTP status code of 200:
prometheus_http_requests_total{handler="/api/v1/query", code="200"}
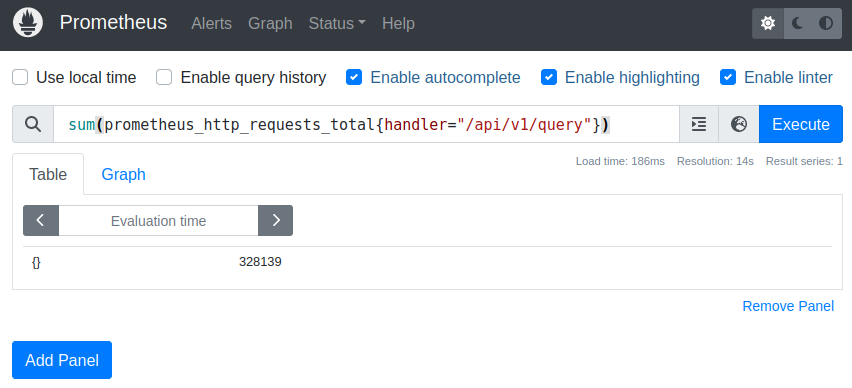
For summing up all the requests for a certain handler, we simply use the sum function:
sum(prometheus_http_requests_total{handler="/api/v1/query"})
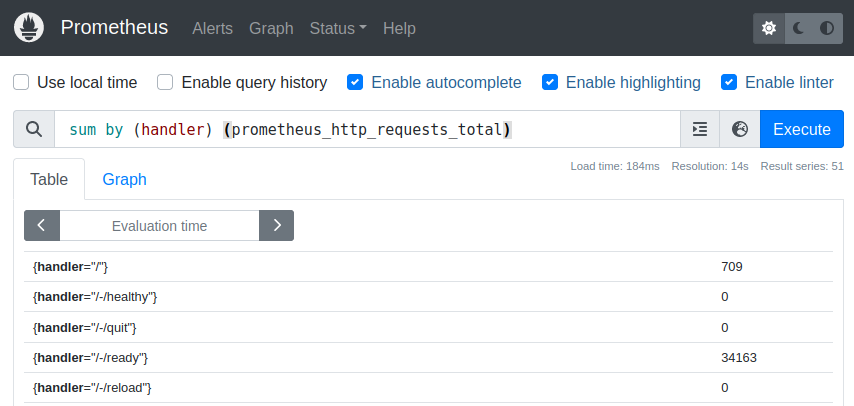
If we are not only interested in the sum of one specific handler, but in the sum for every single handler, we have to sum by the handler tag:
sum by (handler) (prometheus_http_requests_total)
And vice versa, we can calculate the sum without the handler, where the handler does not show up in the result tags:
sum without (handler) (prometheus_http_requests_total)
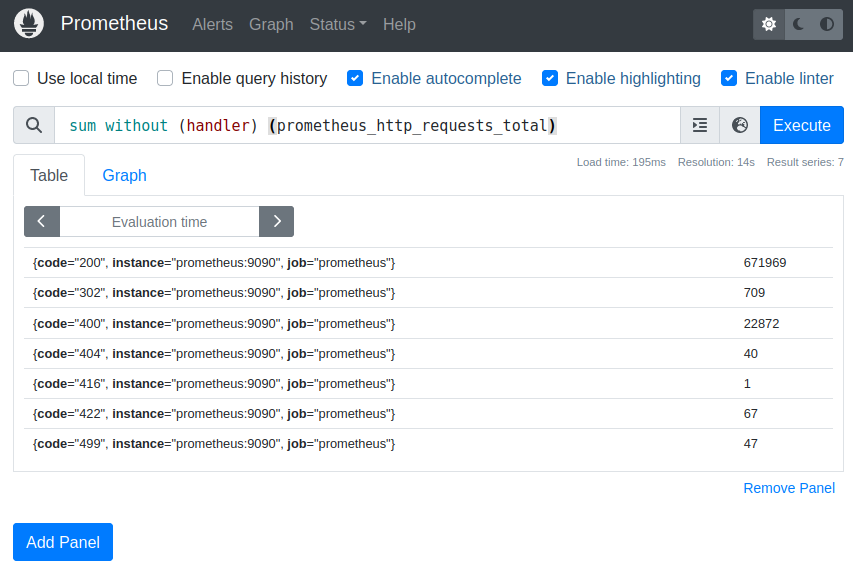
This results means that there have been 671969 HTTP requests with status code 200, regardless of the handler that was dealing with these requests.
All these queries are simple examples for the Prometheus Query Language (PromQL). Instead of typing these queries into the user interface, you can also send them directly to the HTTP API of Prometheus like this:
https://demo.promlabs.com/api/v1/query?query=prometheus_http_requests_total
To see how the HTTP request counters have grown over time, switch over to the Graph tab in the user interface:
To get the same data via HTTP API, you must provide additional parameters for the start timestamp, end timestamp, and the “step” size in seconds (i.e., how many seconds shall be between two data points):
https://demo.promlabs.com/api/v1/query_range?
query=prometheus_http_requests_total&
start=1702735100&
end=1702735200&
step=10
The result of this query is called a range vector. In contrast to an instant vector, it does not only return the values for a specific instant in time, but for a time range.
The metric we have queried so far is a counter, which means that it can only increase over time (and sometimes might get reset to 0, like when the application restarts). For a nice monitoring dashboard, you would rather like to know how many new requests have arrived in a certain period of time. For instance, if you want to know how much the counter has increased in the last five minutes, use the following query:
increase(prometheus_http_requests_total{handler="/api/v1/query", code="200"}[5m])
If you type this query into the “table” tab, you get a single value as expected:
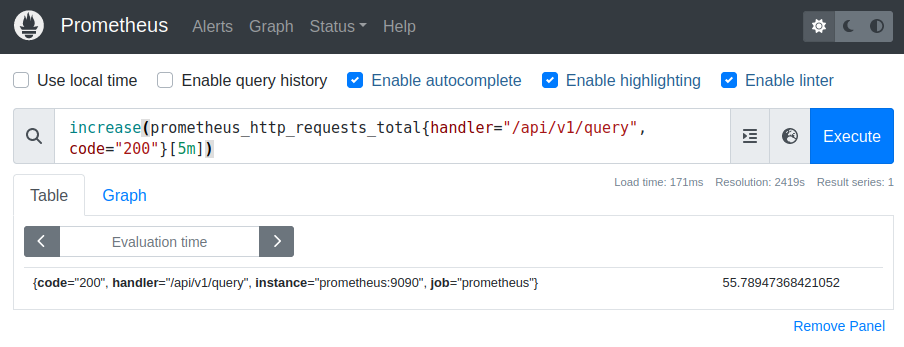
The result value is not an integer because of extrapolation: Since the points in time where Prometheus gathers its data might differ from the points in time that your query demands, Prometheus tries to calculate the exact value at the requested points in time:
When using the HTTP API, you will have to URL-encode the query:
https://demo.promlabs.com/api/v1/query?
query=increase%28prometheus_http_requests_total%7B
handler%3D%22%2Fapi%2Fv1%2Fquery%22%2C%20
code%3D%22200%22%7D%5B
5m%5D%29
As before, when you switch to the “graph” tab, you won’t get just a single value, but a series of values represented as diagram:
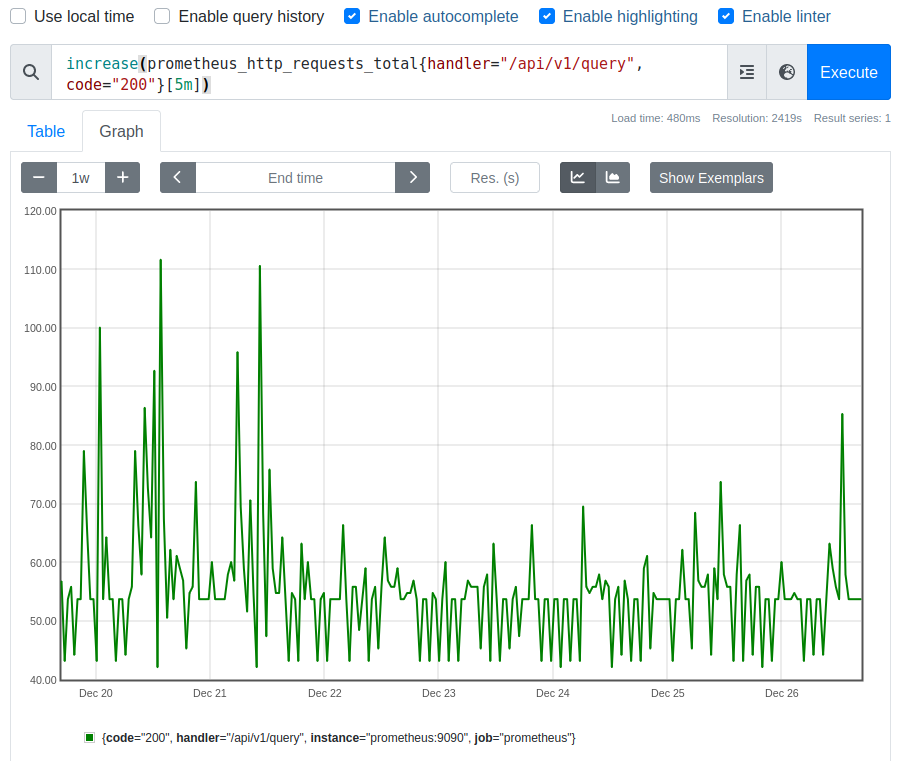
Every single of these graph values gives you the increase of the HTTP requests over the last five minutes.
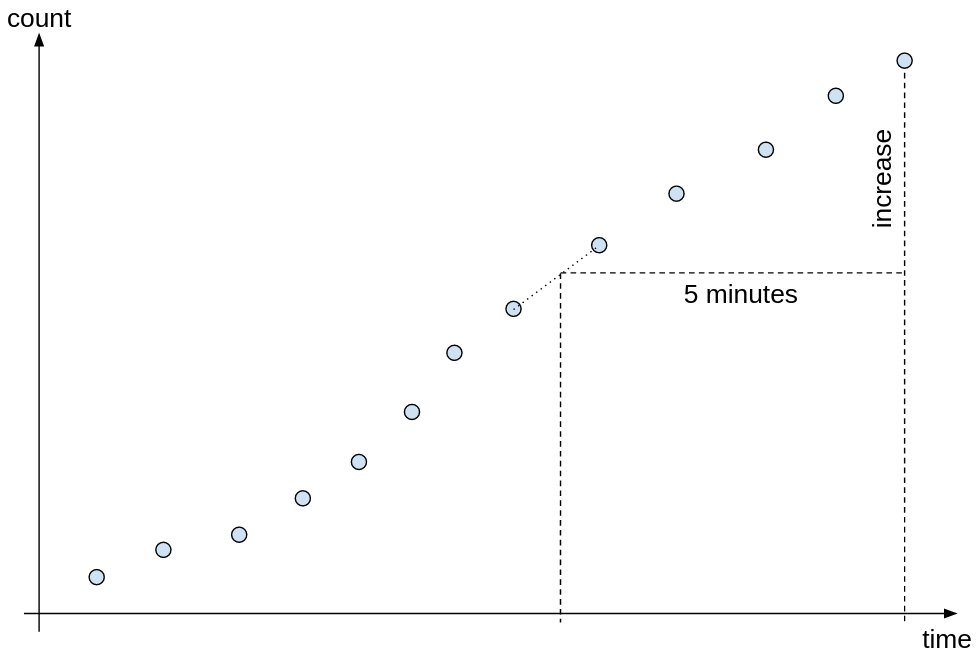
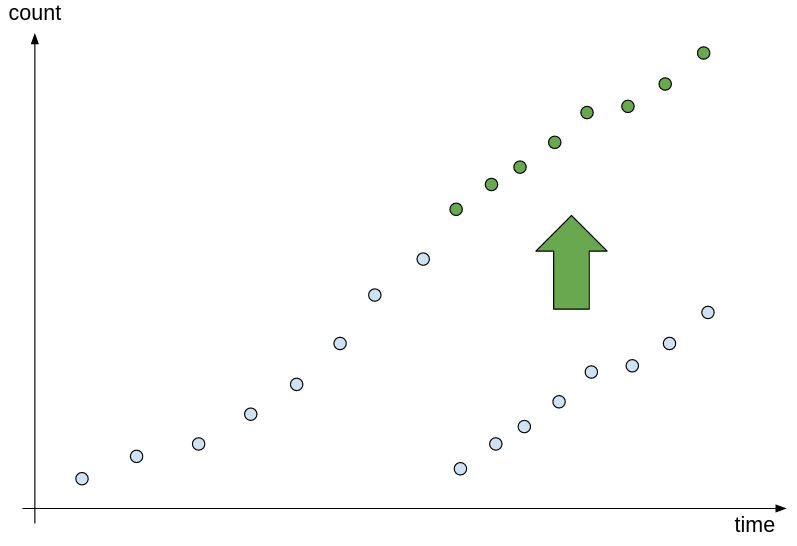
The “increase” function (and also other functions that are specifically tailored to work with counters) deals with the fact that counters can be reset to zero from time to time. It does so by detecting points where the counter has decreased, and shifting the values after these points upwards:
By replacing the “increase” function with the “rate” function, you will get the number of requests per second inside the given time window. This means that in addition to computing the actual increase, this increase is divided by the number of seconds in the time window.
rate(prometheus_http_requests_total{handler="/api/v1/query", code="200"}[5m])
And finally, “rate” is sometimes confused with the “irate” (instant rate) function. The big difference between these two is that “irate” takes the last two values inside the given time range to compute the increase, and not (like the rate function) the first and the last one. For this reason, “irate” is not recommended for alerting, as a brief, but steep increase between these last two points will lead to a high “irate” result value.